Marginal costing - Break even analysis
Marginal costing
Marginal costing is the cost accounting system in which variable costs are charged to cost units and fixed costs of the period are written off in full against contribution. The marginal cost of an item is its variable cost. Contribution gives an idea of how much money is available to 'contribute' towards paying the overheads of the organisation.
Total contribution
= Sales – Total variable cost
= Sales – (Direct materials + direct labour + variable overheads)
= Fixed cost + Profit
= CS Ratio × Revenue
Contribution per unit
= Selling price – Variable costs per unit
= Selling price – (DM/unit + DL/unit + VO/unit)
= Total contribution ÷ No of units
= CS Ratio × Selling price
= Change in profit ÷ Change in units
NOTE: Whatever be the level of output contribution per unit always remain the same.
Contribution to sales ratio
The CS ratio is one of the most important tools used in profit management for studying the profitability of a business. It's called also profit/volume ratio or marginal ratio. The C/S ratio is a measure of how much contribution is earned from each US$1 of sales. Whatever be the level of output the CS ratio always remains the same.
Contribution to sales ratio (CS Ratio)
= Contribution ÷ Sales × 100
= Contribution per unit ÷ selling price × 100
= Change in profit ÷ Change in revenue
Marginal profit and loss statement (IN UNIT) | ||
$ | $ | |
Selling price | * | |
Less Variable cost: | ||
Direct materials per unit | * | |
Direct labour per unit | * | |
Variable overheads per unit | * | (**) |
Contribution per unit | * | |
× | ||
No of Units | * | |
Total Contribution | *** | |
Less Fixed cost | (*) | |
Profit / (Loss) | * | |
Marginal profit and loss statement (IN TOTAL) | ||
$ | $ | |
Sales | * | |
Less Variable cost | ||
Direct Materials | * | |
Direct Labour | * | |
Variable overheads | * | (**) |
Total contribution | * | |
Less Fixed cost | (**) | |
Profit / (Loss) | * | |
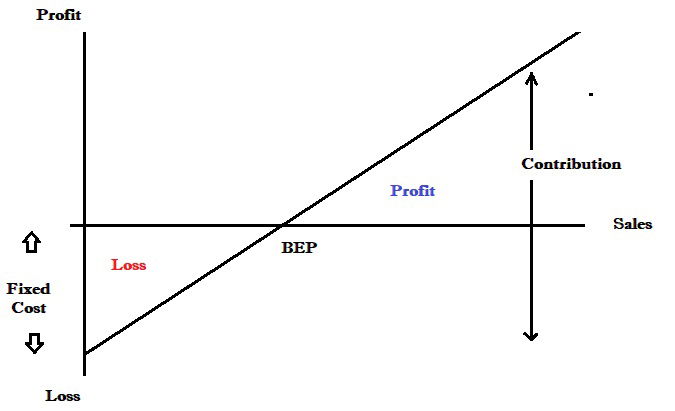
Break-even point (BEP)
The breakeven point is the point at which there is neither profit nor loss. At this point, total cost is equal to total revenue and contribution is equal to fixed cost. The Break-even point can be calculated in units or dollars
BEP (Units)
= Fixed cost ÷ Contribution per unit
= Fixed cost ÷ (Selling price- Total variable cost per unit)
BEP (Dollars)
= Fixed cost ÷ CS Ratio
= Fixed cost ÷ Contribution per unit × Selling price
= Fixed cost ÷ (Selling price- Total variable cost per unit) × Selling price
Margin of safety
The margin of safety indicates by how much sales may fall before the business starts incurring losses. It is calculated as follows:
Margin of safety (Units)
= Actual sales (units) – BEP (units)
= Profit ÷ Contribution per unit
Margin of safety (Dollars)
= Actual revenue – BEP (Dollars)
= Profit ÷ CS Ratio
Target Profit
Sales volume (units) required to earn target profit = (Fixed cost + Target profit) ÷ Contribution per unit
Sales revenue ($) required to earn target profit = (Fixed cost + Target profit) ÷ CS Ratio
Break even Chart

Profit Volume chart
A profit-volume (PV) chart is a graphic that shows the earnings (or losses) of a company in relation to its volume of sales. Companies can use profit-volume (PV) charts to establish sales goals, analyze whether new products are likely to be profitable, or estimate breakeven points.